Partou is practicing Balochi needlework.
Video 1
Video 2: Experimenting with Balochi's needlework

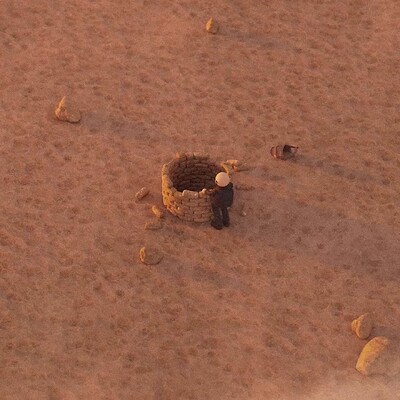
Figure 1: Initial map for Processing
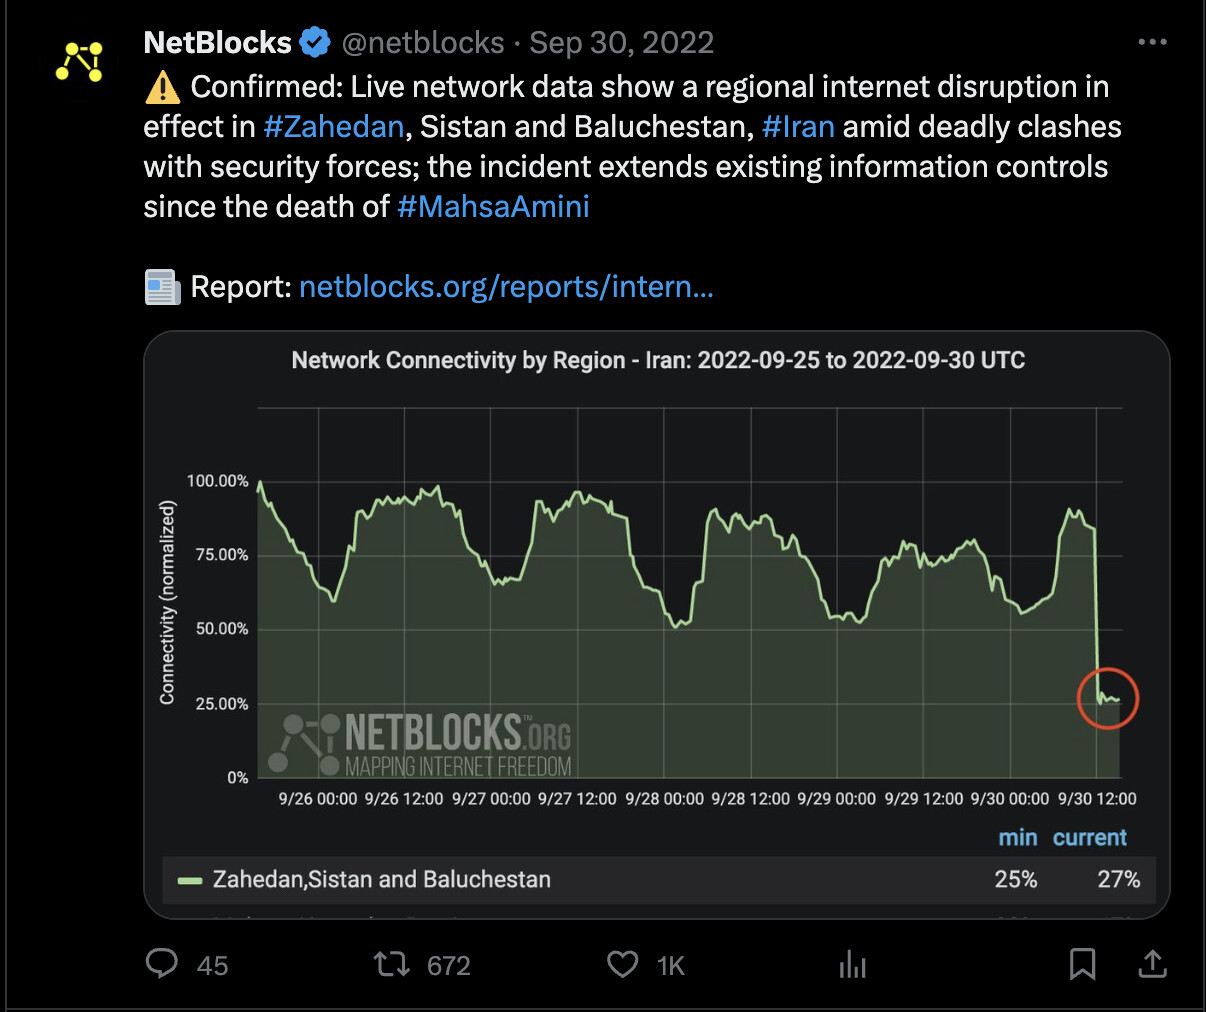
Figure 2: Sample tweet from the Netblocks Twitter account regarding Iran's internet disruption
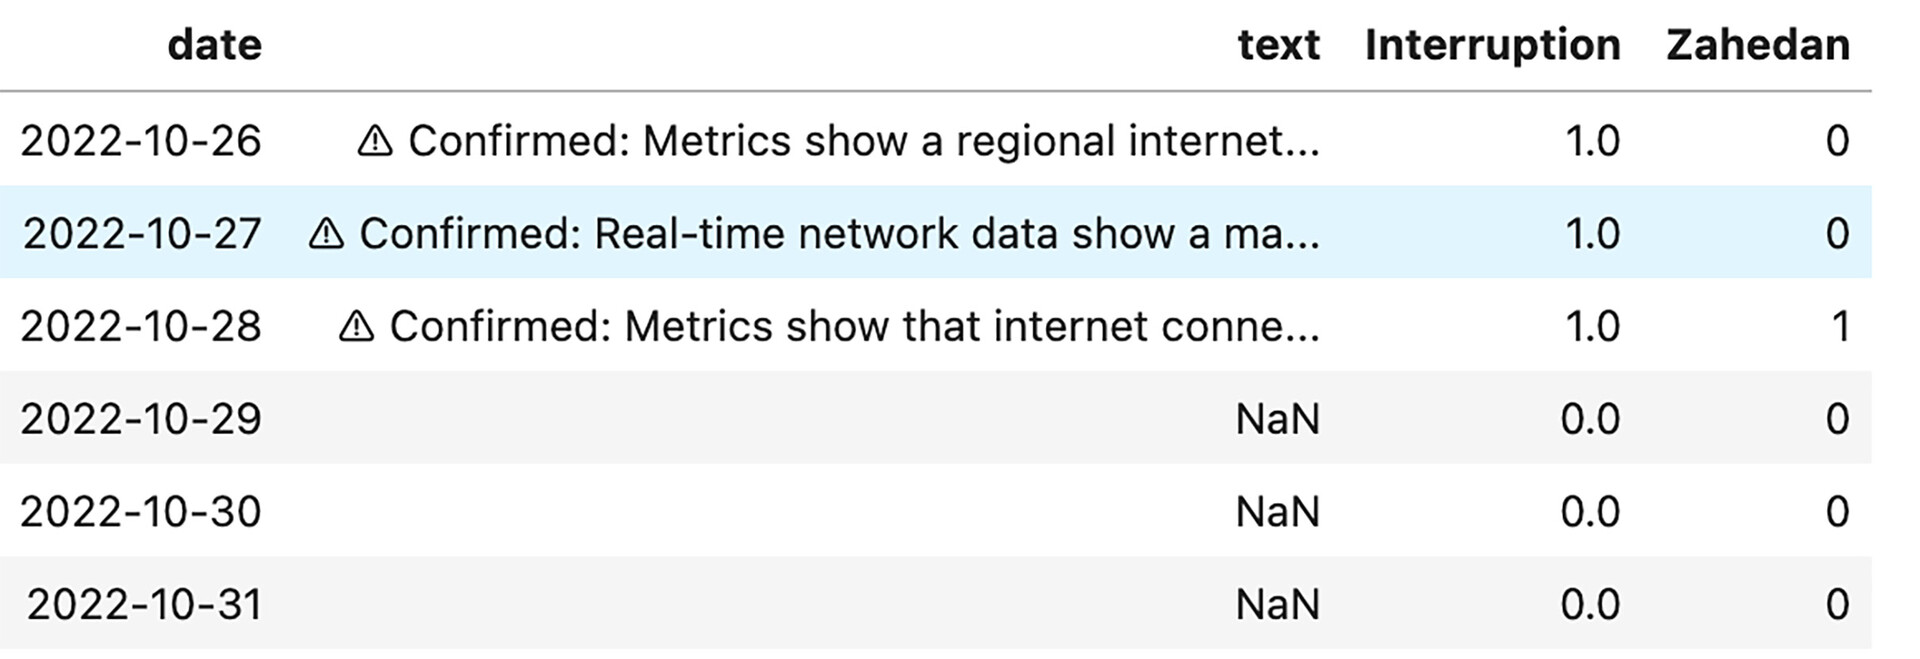
Figure 3: A sample of preprocessing results displays three consecutive days of interruption from 10/26/2022 to 10/28/2022, followed by three days with no interruption.
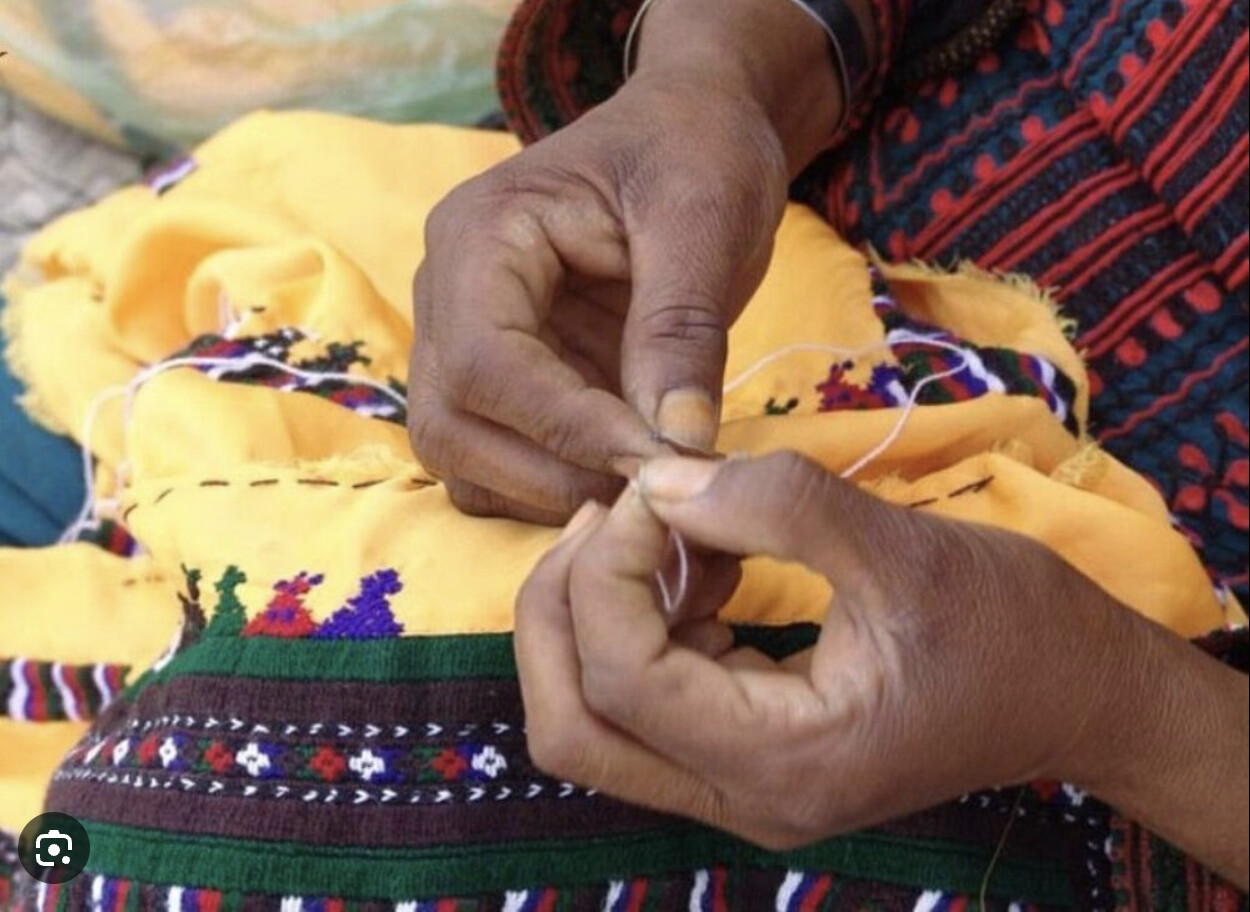
Figure 4: Balochi Needlework
Video 4: Pushing or Passing (pixel experiment)
"Domestic Counterattack" is an interactive project in progress that utilizes facts, data, 2D and 3D animations, as well as video games, to illustrate how the government attempts to suppress women in Iran. It specifically focuses on the life experiences of a particular group of women business owners in Sistan and Baluchistan, an Iranian province. These women have built their businesses around a traditional handicraft called needlework (سوزن دوزی / soozan doozi) (Figure 4). Their needlework, which I consider both an art form and a handicraft, serves as a crucial source of income and empowerment. Their survival, both as a business and as an art, however, has been increasingly dependent on the Internet; they market and sell their products mostly using online platforms.
In the initial phase of my project, I conducted data gathering and preprocessing, focusing on incidents of internet disruption in Iran. The data was extracted from daily tweets posted on the Twitter account @netblocks (Figure 2). NetBlocks is a watchdog organization that monitors cybersecurity and Internet governance. Following the extraction, I performed data preprocessing to compile a comprehensive daily status report on internet accessibility in Iran spanning from November 2021 to November 2023. Figure 3 shows a sample of preprocessing results.
Afterward, I used the Processing software language to integrate my data with Baluch motifs, resulting in visualizations. Video 1 represents the outcome of my initial attempt. Each frame corresponds to a single day, with the presence of the red color indicating a day marked by internet disruption. The recurring instances of red within a specific timeframe highlight a concerning pattern. This visual representation vividly illustrates the frequency and persistence of internet disruptions, underscoring the ongoing challenges faced by the community.